Interactive 3D Plots
ORCaS Solar Layout Analysis results have always been delivered as raw data and static plots that partners can integrate into plan sets. While effective, these formats are less ideal for closely examining critical layout details such as row alignment, elevation countour after grading, height to center-of-torque-tube, or pile-specific cut and fill. Subtle issues may go unnoticed until late in the design process.
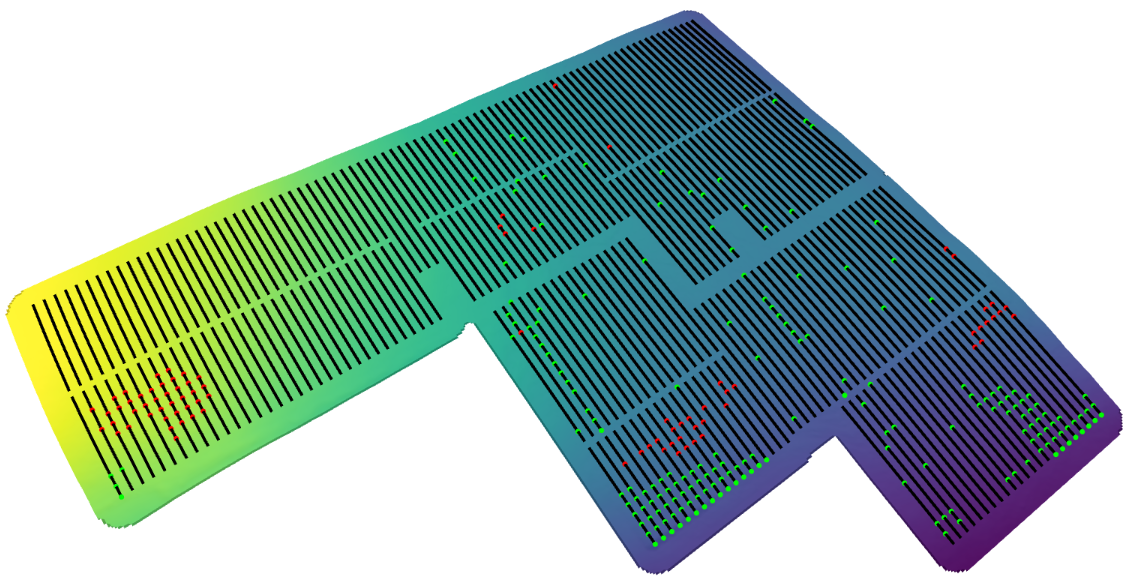
To address this, ORCaS now offers Layout Analysis results as interactive, web-based 3D plots. These visualizations allow engineering and design teams to explore site layouts in greater detail:
- Post-grade topography is color-contoured, making slope and elevation changes immediately apparent.
- Grading adjustments are marked pile by pile, with green (cut) and red (fill) indicators.
- Panel rows are represented by line segments that clearly display row slope, installed torque-tube heights, and row-to-row alignment.
These features provide a more intuitive understanding of site characteristics, supporting faster iteration and validation as teams refine layouts into buildable designs.
Interactive Plots can be requested directly in our Layout Analysis request form or by including plot type I in the addtlplots constant of your Constants spreadsheet or JSON file.